Over the years, many webinars, articles, and conference lectures have addressed the topic of translation and interpretation fees. Conventional wisdom seems to suggest that the best way to approach this problem is to assess a number of parameters, such as expenses, desired income, and cost of living, on which we calculate our fees based on our personal needs and goals.
However, in a highly individualistic profession, where most of us work secluded in our home offices, we often feel the need to compare ourselves with our peers. This is particularly true this year because of the COVID-19 pandemic, which brought increased isolation due to the cancellation of many in-person events, a heightened level of uncertainty, and the need to re-evaluate some aspects of our businesses. We have to prepare for the post-COVID era, and for this reason we need a historical perspective, on which to base our future decisions.
In recent years, the American Translators Association has helped to find answers to some of these questions by commissioning the Translator and Interpreter Compensation Survey. To view the Summary of the 5th Translation and Interpreting Services Survey, you can visit https://www.ata-chronicle.online/featured/summary-of-the-ata-translation-and-interpreting-services-survey/ This has proven to be an invaluable tool not only for established professionals to assess market trends, but also as a guide for students who are considering a career in this profession, and for neophytes who otherwise may not have enough information to make informed decisions about their fees. This article will analyze part of the survey data to compare trends over the past few years.
The ATA commissioned the first edition of the Translator and Interpreter Compensation Survey to Industry Insights, Inc. in 1999. Other editions followed in 2002 (published in 2003), 2005, 2007, and 2015 (published in 2016). Each edition was compiled based on the answers to questions relating to the previous year —for example, the 2005 survey reflects the situation as of December 31, 2004. According to Mary David, Assistant Executive Director at ATA, the time gap between the fourth and fifth edition of the survey was due to a change in the association’s budget priorities. As of last year, a specific committee was working on the next survey.
The executive summaries that present the findings for each survey show how the tool has evolved over time, adding new questions and processing the data more comprehensively. For this reason, the same information cannot be compared over all five surveys, making this analysis by no means exhaustive.
The surveys were administered through an email with a link to an online questionnaire. Professionals, regardless of ATA membership, were contacted via the same email and invited to participate. The only requirement for participation was working in the translation and interpretation industry. The surveys analyzed seven employment categories: full-time independent contractors, part-time independent contractors, full-time in-house private sector personnel, part-time in-house private sector personnel, translation and interpretation company owners, educators, and government employees. The responses were then broken down by geographic region, education, years of employment, primary language combination, ATA membership status, and ATA accreditation status.
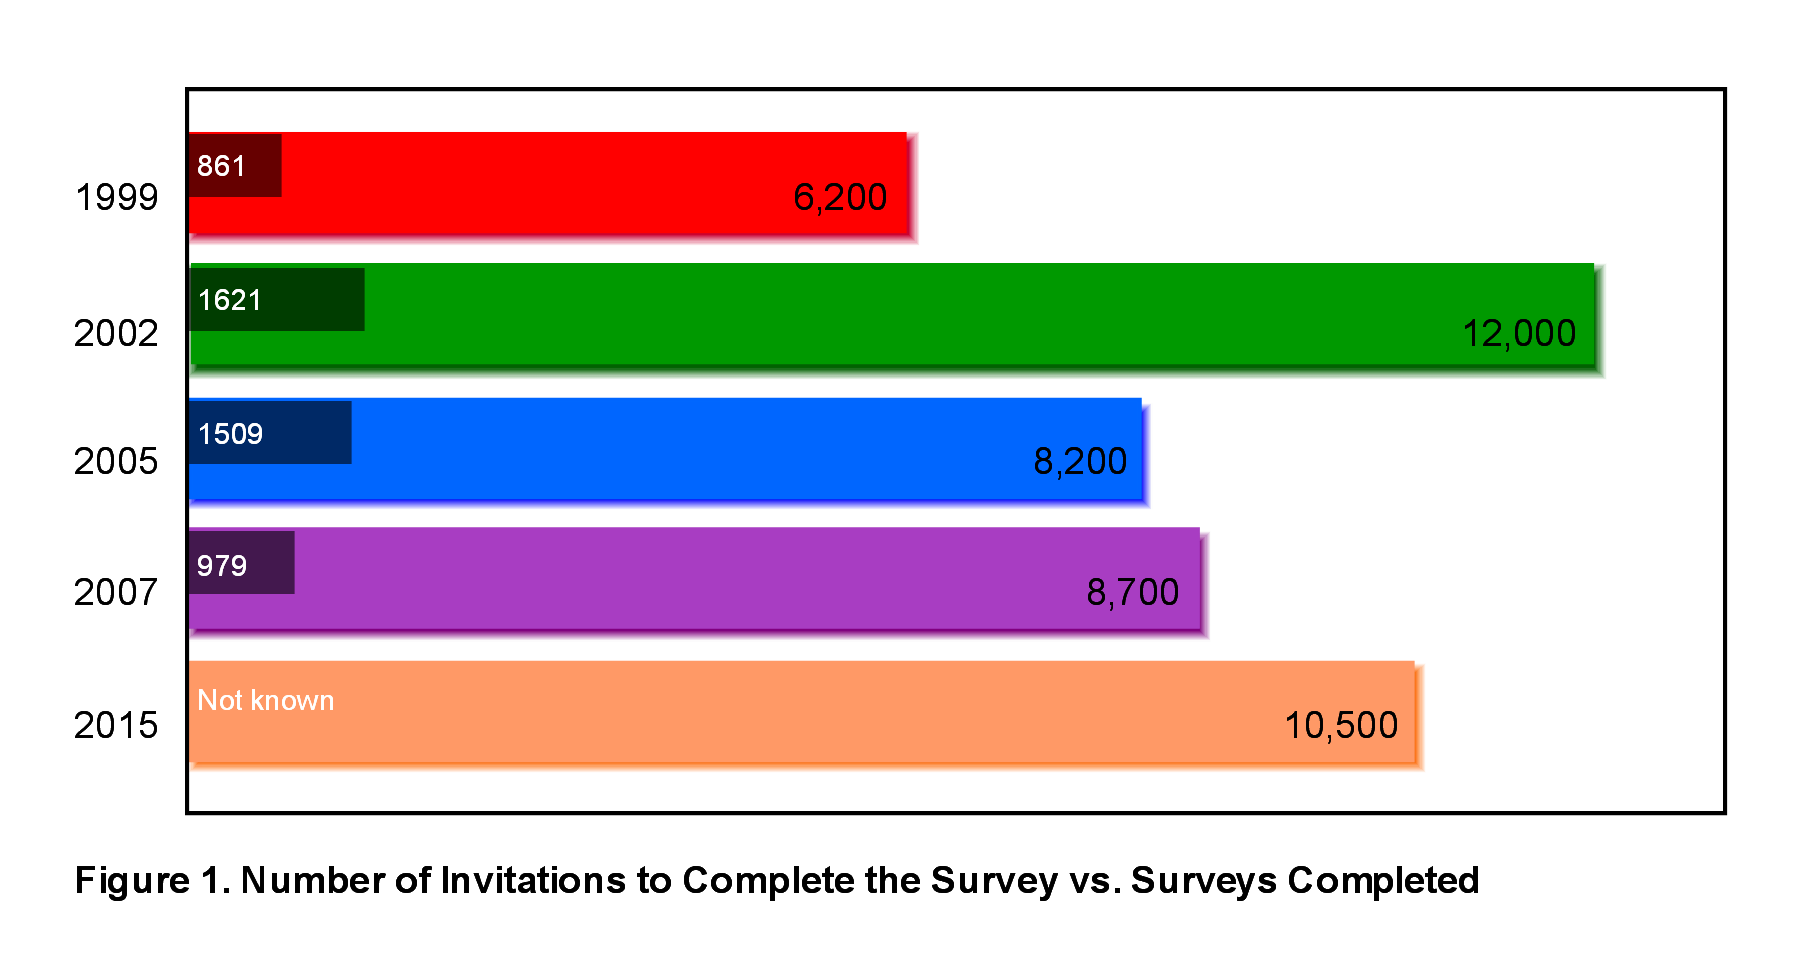
The number of professionals contacted and the number of respondents who accepted the invitation varied between editions as follows (see Fig. 1):
- Approximately 3,100 ATA members and 3,100 nonmembers (6,200 total) were surveyed in April 1999, with 861 completed surveys
- 12,000 ATA members and nonmembers were surveyed in 2002, with 1,621 completed surveys
- 8,200 ATA members and nonmembers surveyed in 2005; 1,509 completed surveys
- 8,700 ATA members and nonmembers surveyed in 2007; 979 completed surveys
- For the 2016 survey, approximately 10,500 ATA members were invited to answer, but it is not known how many non-members were contacted, or how many responses were received.
The respondents were asked to answer questions regarding several aspects of their job, including years of employment in this industry, gross income related to their translation and interpreting profession, and rates per hour and per word—these are the data we are going to focus on for the purpose of this article.
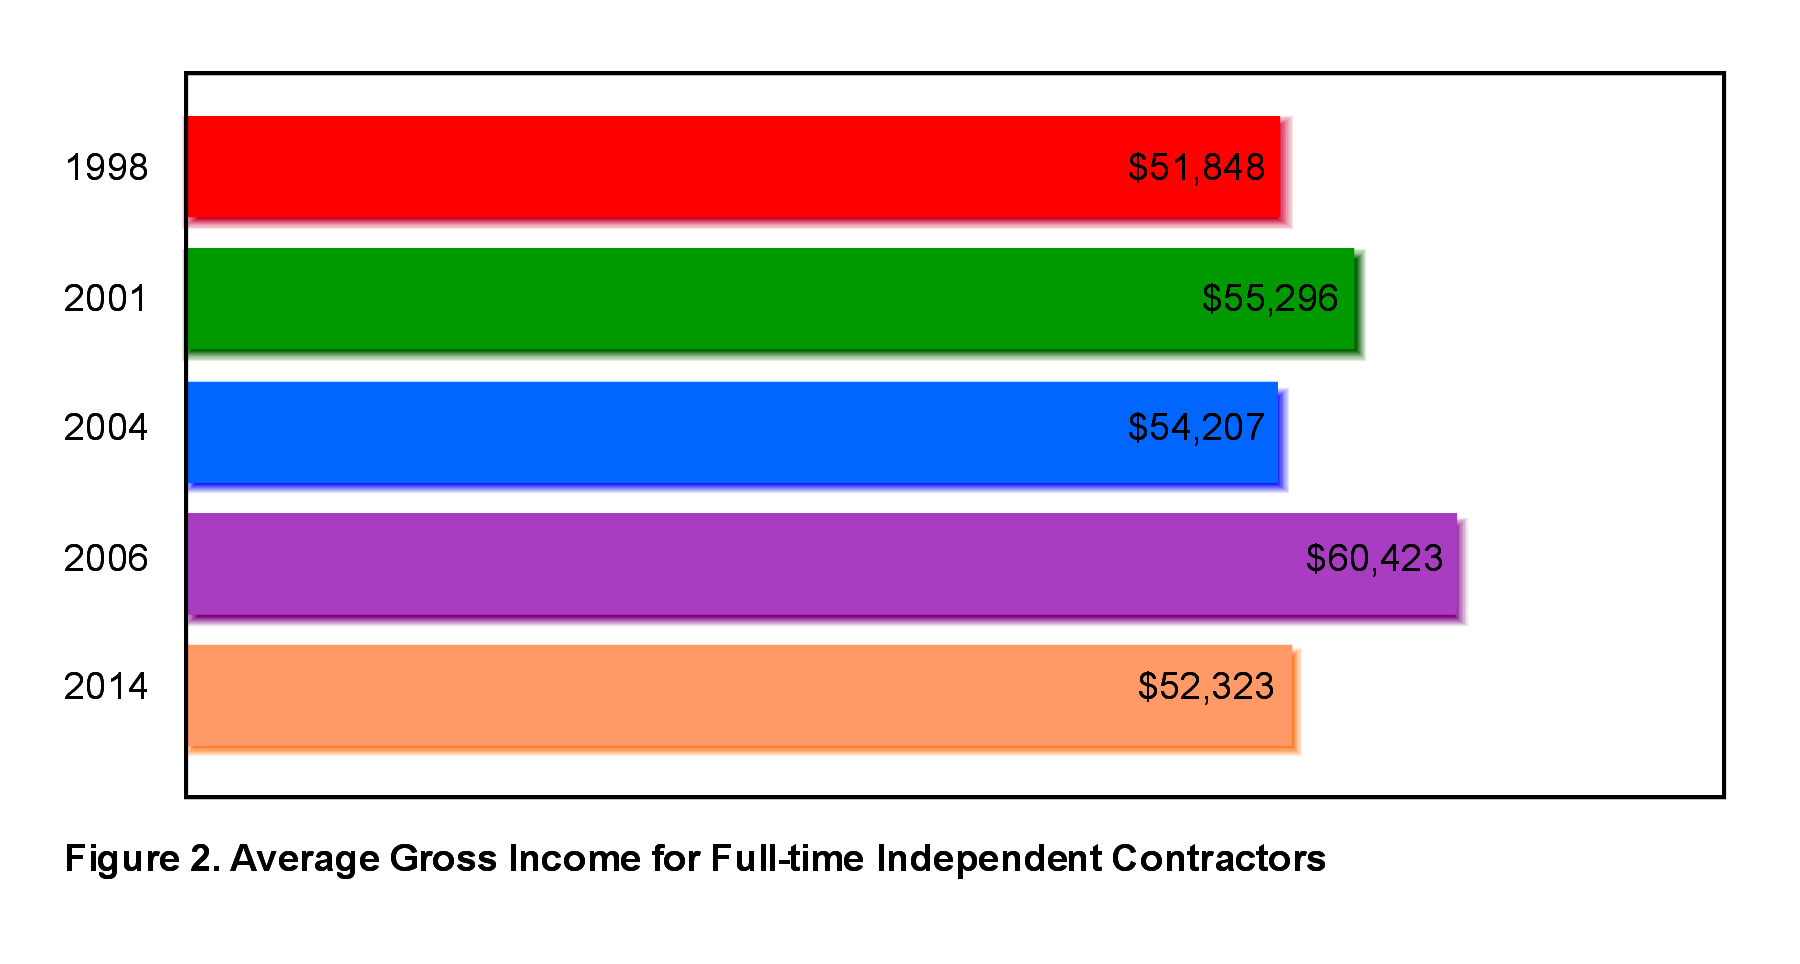
The average gross income for full-time independent contractors in the translation and interpreting field in the US was $51,848 for 1998; $55,296 for 2001; $54,207 for 2004; $60,423 for 2006; and $52,323 for 2014 (see Fig. 2).
By considering this set of data, the decrease in the 2014 average gross income level compared to 2006 stands out. The financial crisis of 2007 may have impacted our profession deeply, and in 2014 we had not yet fully recovered from it.
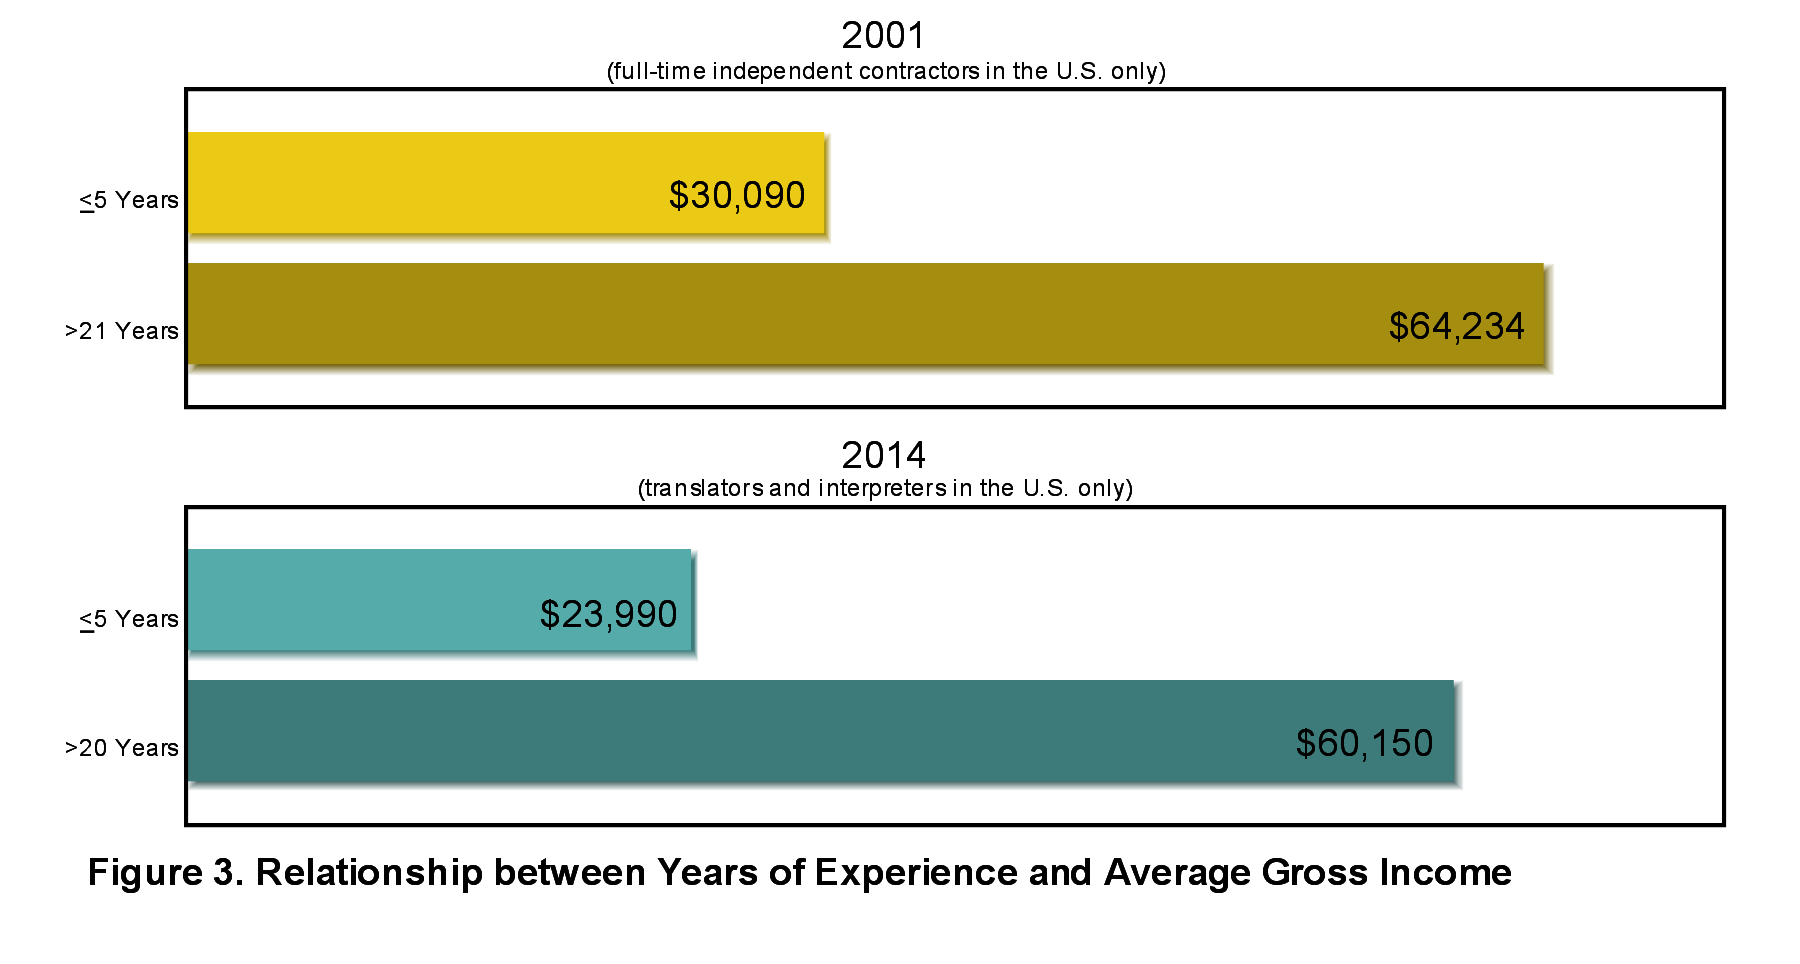
As expected, years of employment play a big part in the amount of money one can make in this profession, as in most professions. For example, full-time independent contractors in the U.S. with up to 5 years’ experience in 2001 earned $30,090 versus $64,234 for those with over 21 years’ experience; likewise, U.S. respondents with up to 5 years experience as translators and/or interpreters earned approximately $23,990 in 2014 as opposed to $60,150 for professionals with more than 20 years on the job (see Fig. 3).
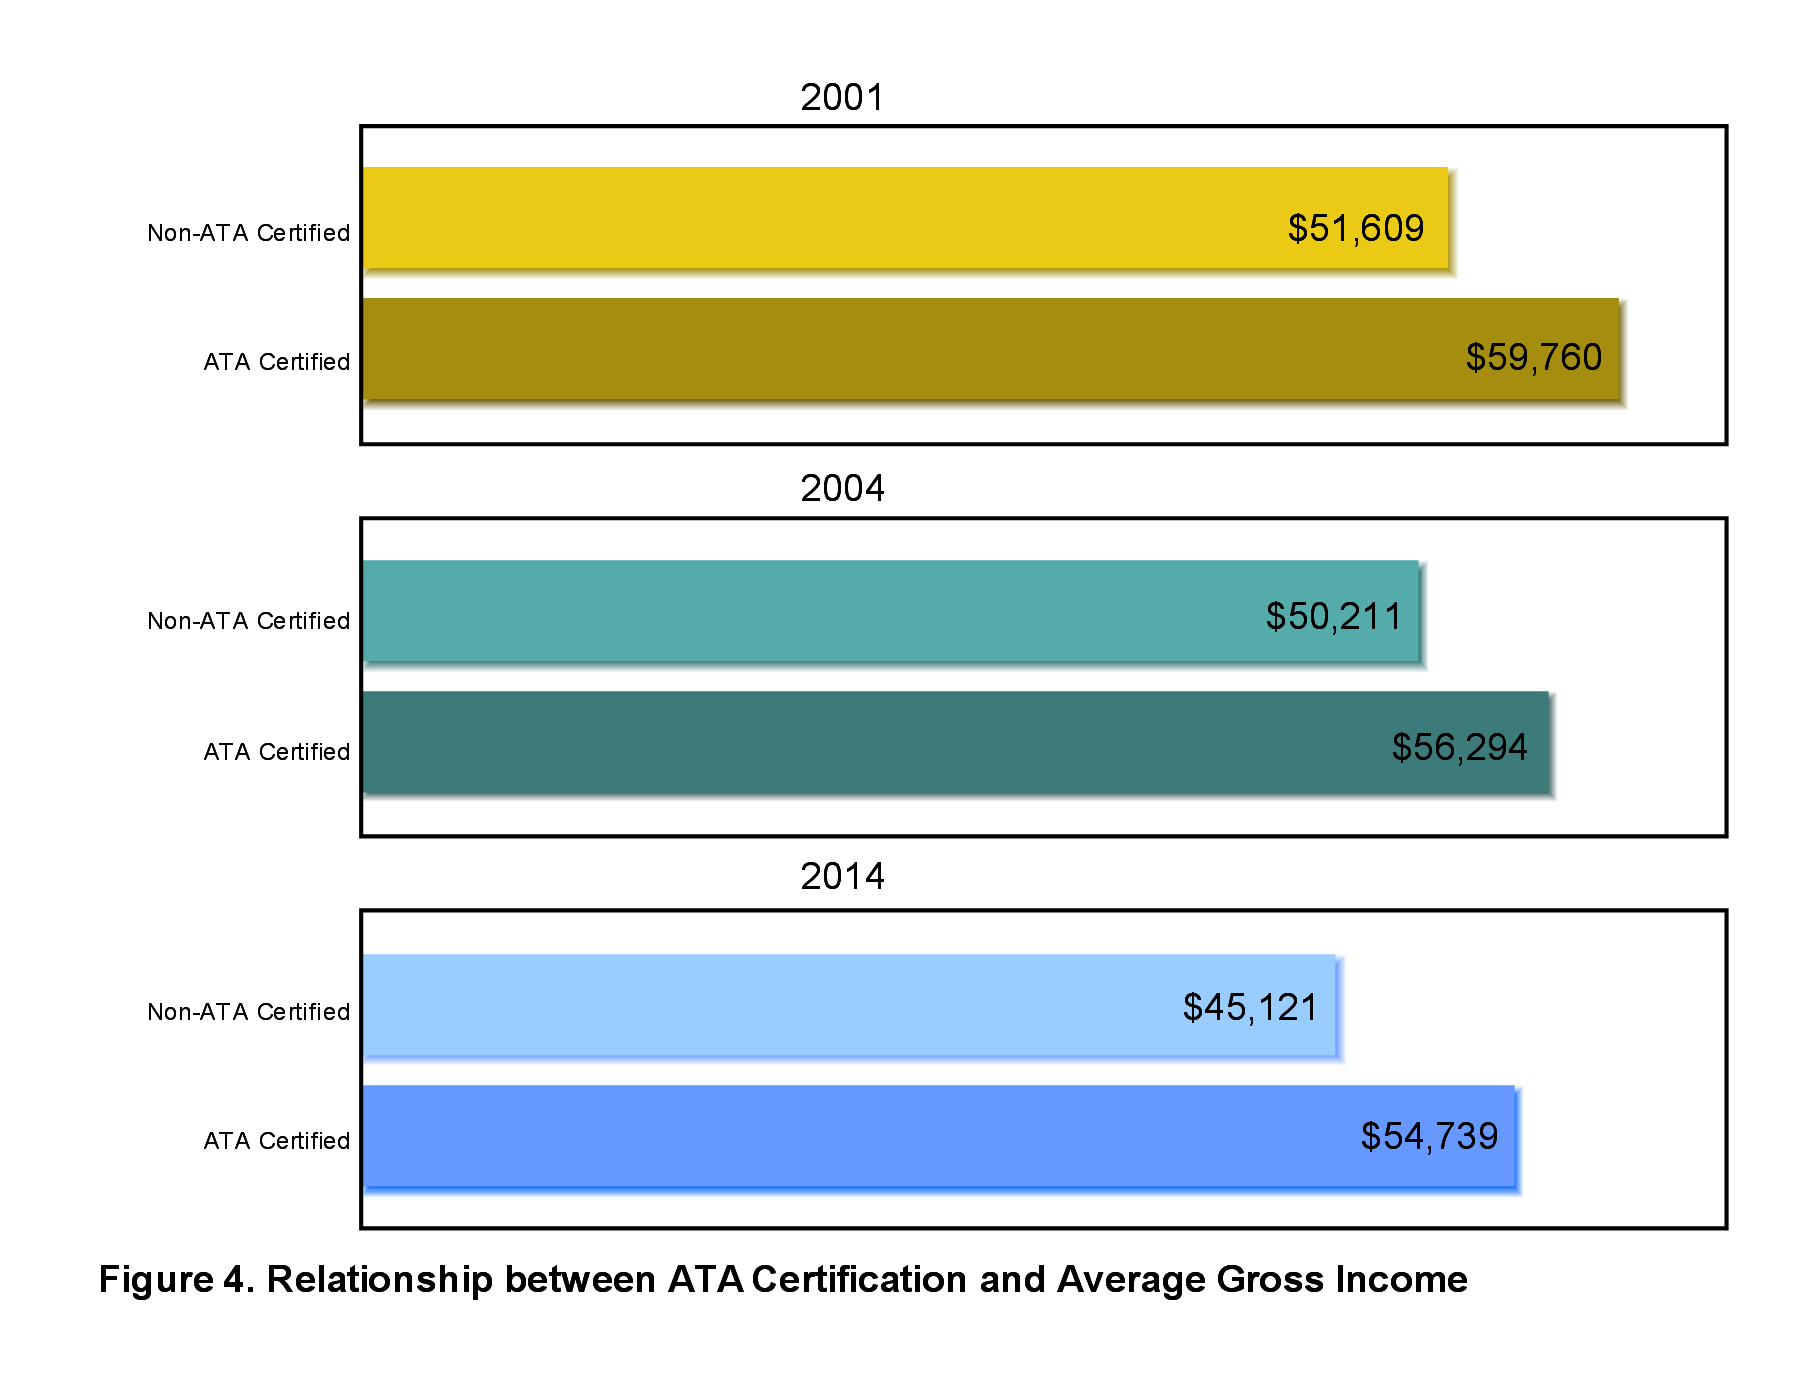
Accreditation status is another important element in the determination of yearly income: in 2001, accredited ATA members in the U.S. earned 16% more than their non-accredited counterparts ($59,760 vs. $51,609); a similar situation was shown in the 3rd edition of the survey ($56,294 vs. $50,211, 12%) with the 5th edition reporting an even greater gap ($54,739 vs. $45,121, 21%) (see Fig. 4).
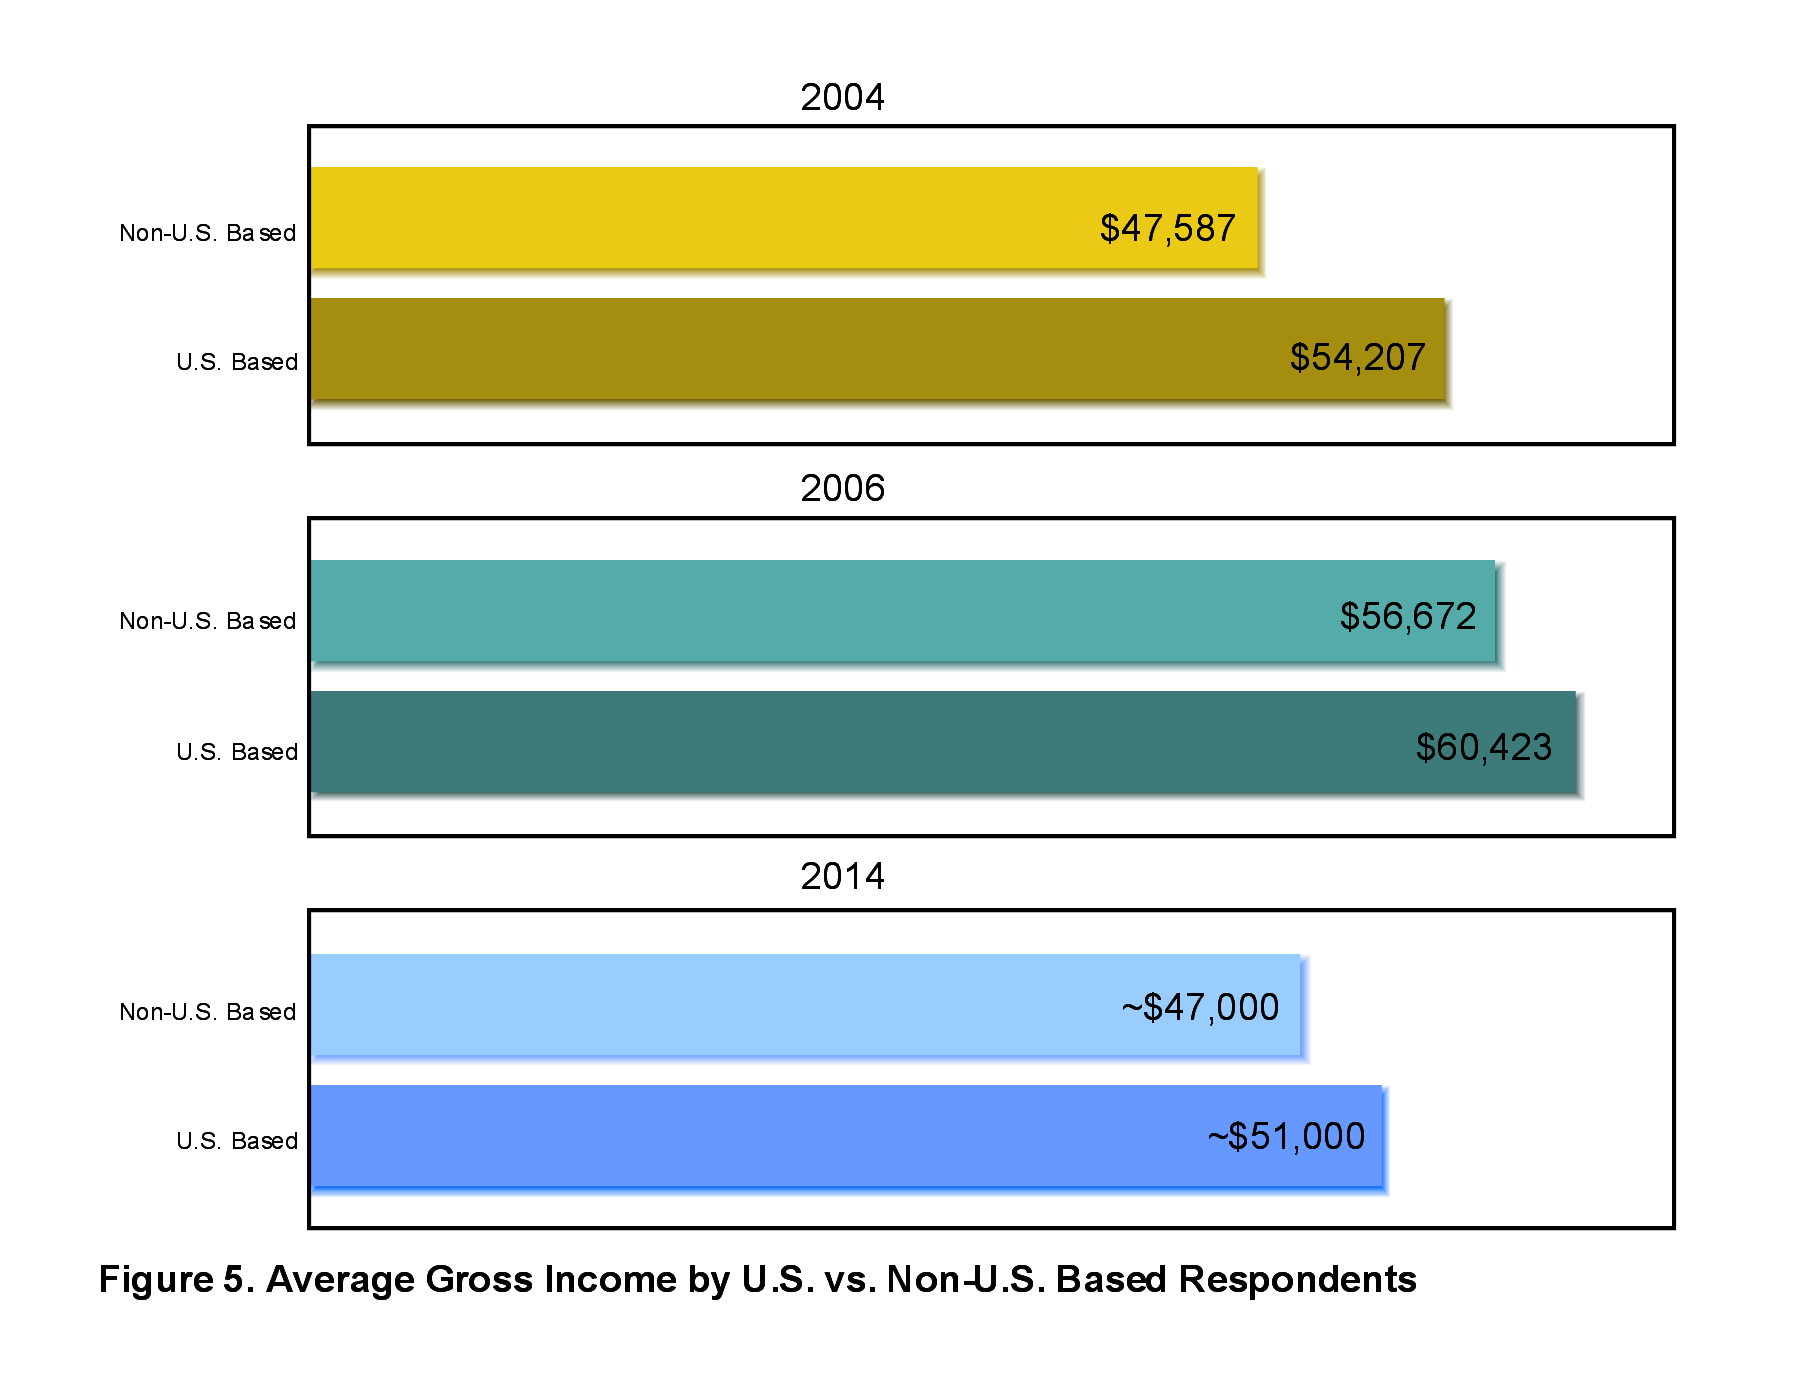
Taking into consideration geographical location, professionals in the U.S. reported higher earnings compared to the rest of the world, as follows (see Fig. 5):
- 2004 $54,207 in the U.S. vs. $47,587 for non-U.S. based professionals
- 2006 $60,423 vs. $56,672
- 2014 ~$51,000 vs. ~$47,000
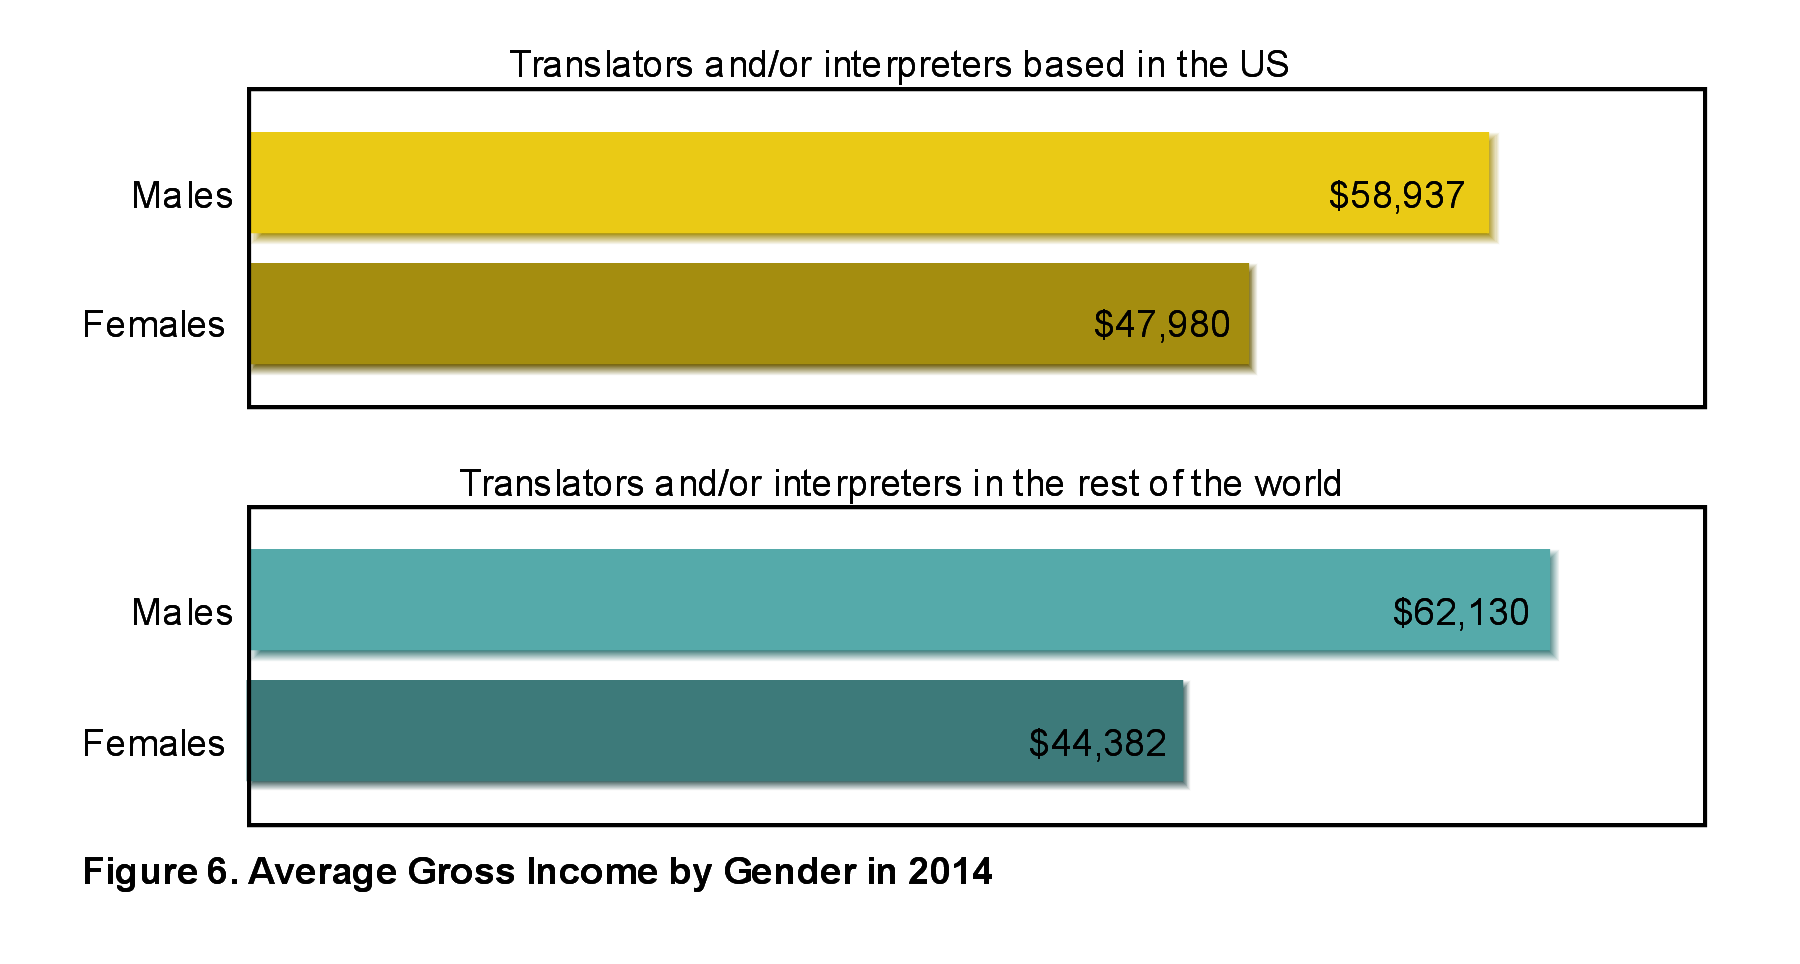
Gender is another major differentiating factor when it comes to income levels. In 2014, the average gross income for male translators and/or interpreters was $58,937 in the U.S. and $62,130 in the rest of the world, while their female counterparts earned $47,980 and $44,382, respectively (see Fig. 6).
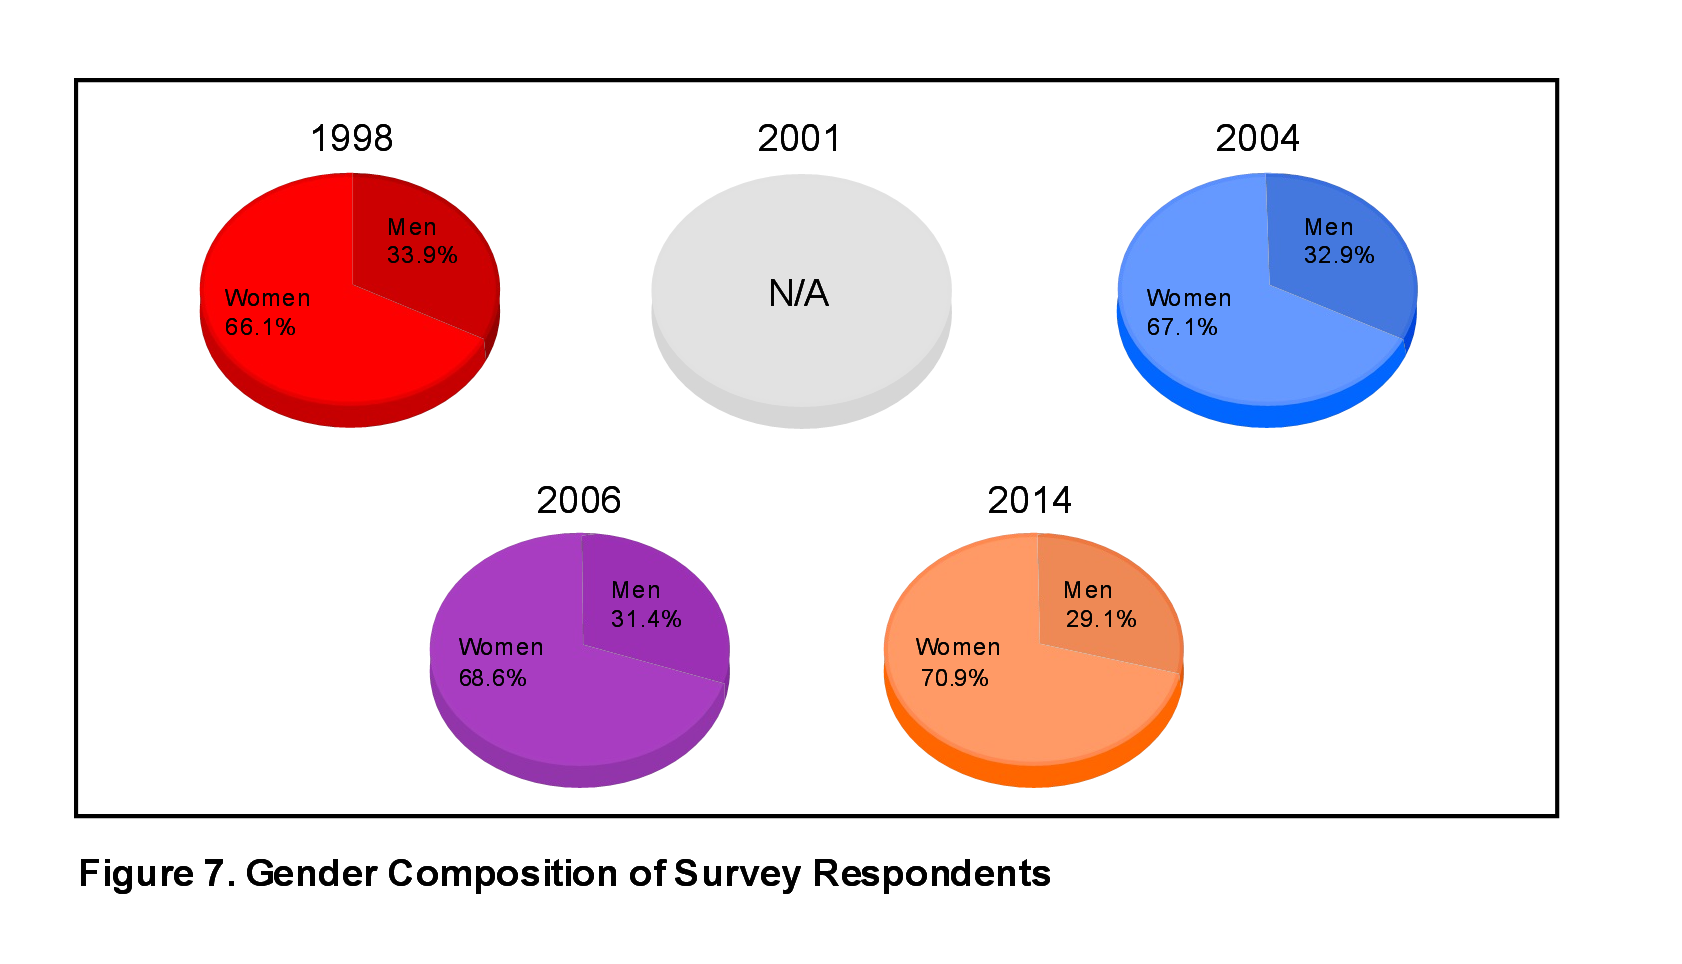
This gender gap is in spite of the overwhelming majority of women working in this industry; 2/3 of language professionals are women. Unfortunately, the summary of the 2nd edition of the Translator and Interpreter Compensation Survey does not report any data on this aspect, but the information reported in the other four survey summaries seems to illustrate the situation quite clearly (see Fig. 7).
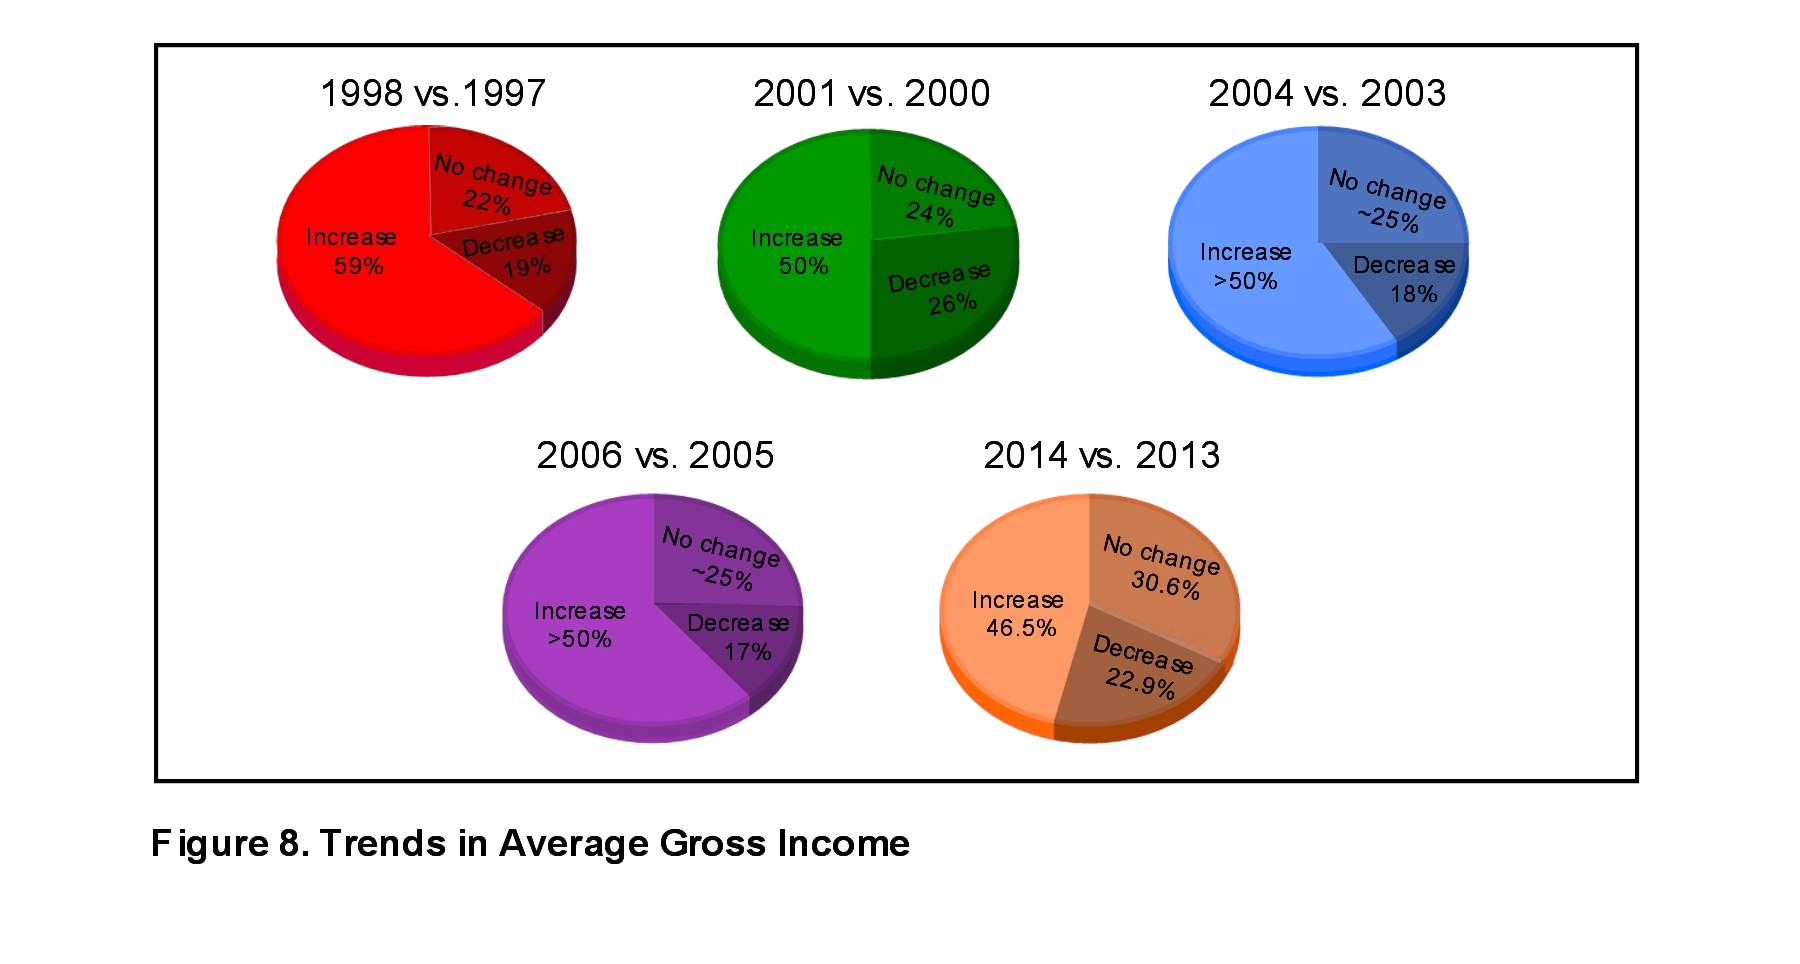
In all editions, about half of the respondents, regardless of employment classification, reported an increase in their income from translation and interpreting compared to the year before (see Fig. 8):
- 59% of all professionals that responded to the 1st edition experienced an income increase in 1998 compared to 1997, 19% reported a decrease, and 22% reported no change
- In the 2nd edition, 50% of all respondents reported an increase compared to 2000, 26% experienced a decrease, and 24% no change
- In the 3rd edition, more than 1/2 increased their income compared to 2003, 18% showed a decrease, and about 1/4 no change
- Similarly, in the 4th edition, more than 1/2 of the respondents experienced an income increase in 2006 compared to 2005, 17% a decrease, and about 25% no change
- In the last edition, 46.5% of all professionals surveyed reported an increase in 2014 compared to 2013, 22.9% a decrease, and 30.6% no change
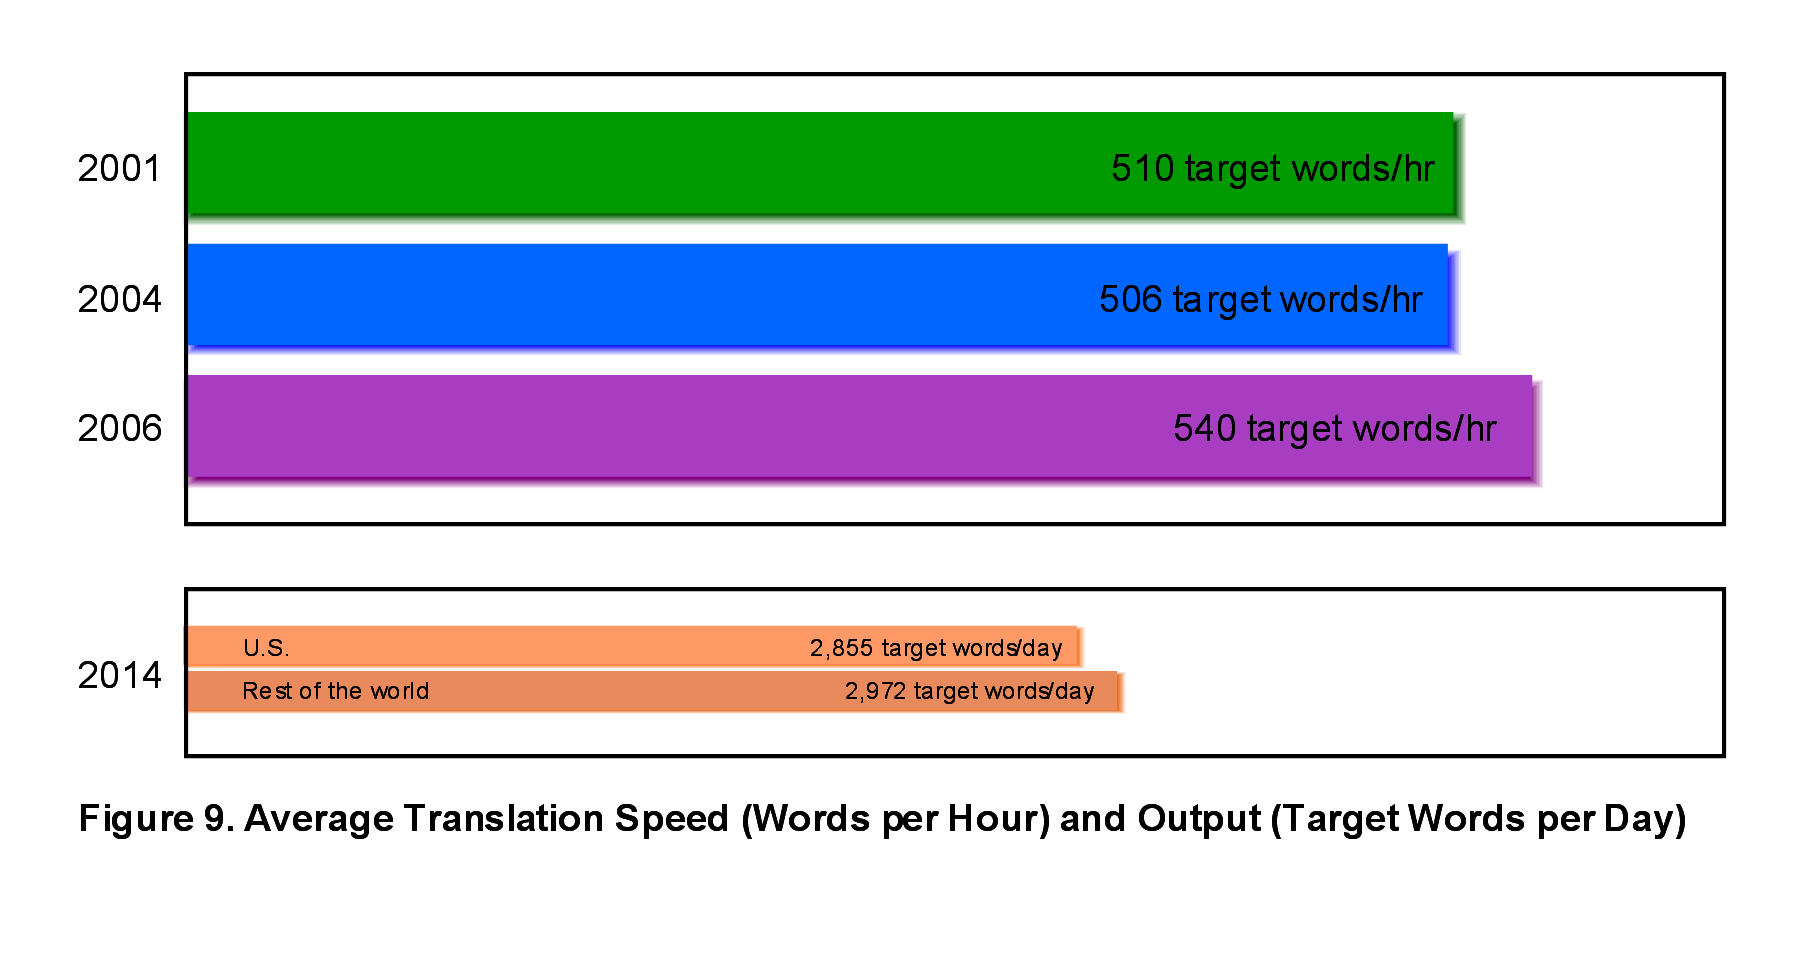
Translation speed was also a factor analyzed in some of the surveys (see Fig. 9):
- 2001 510 target words/hr
- 2004 506 target words/hr
- 2006 540 target words/hr
For 2014, the words per hour were not specified, but the survey asked about the translation output in target words per day: the average was 2,855 for respondents in the US, and 2,972 in the rest of the world.
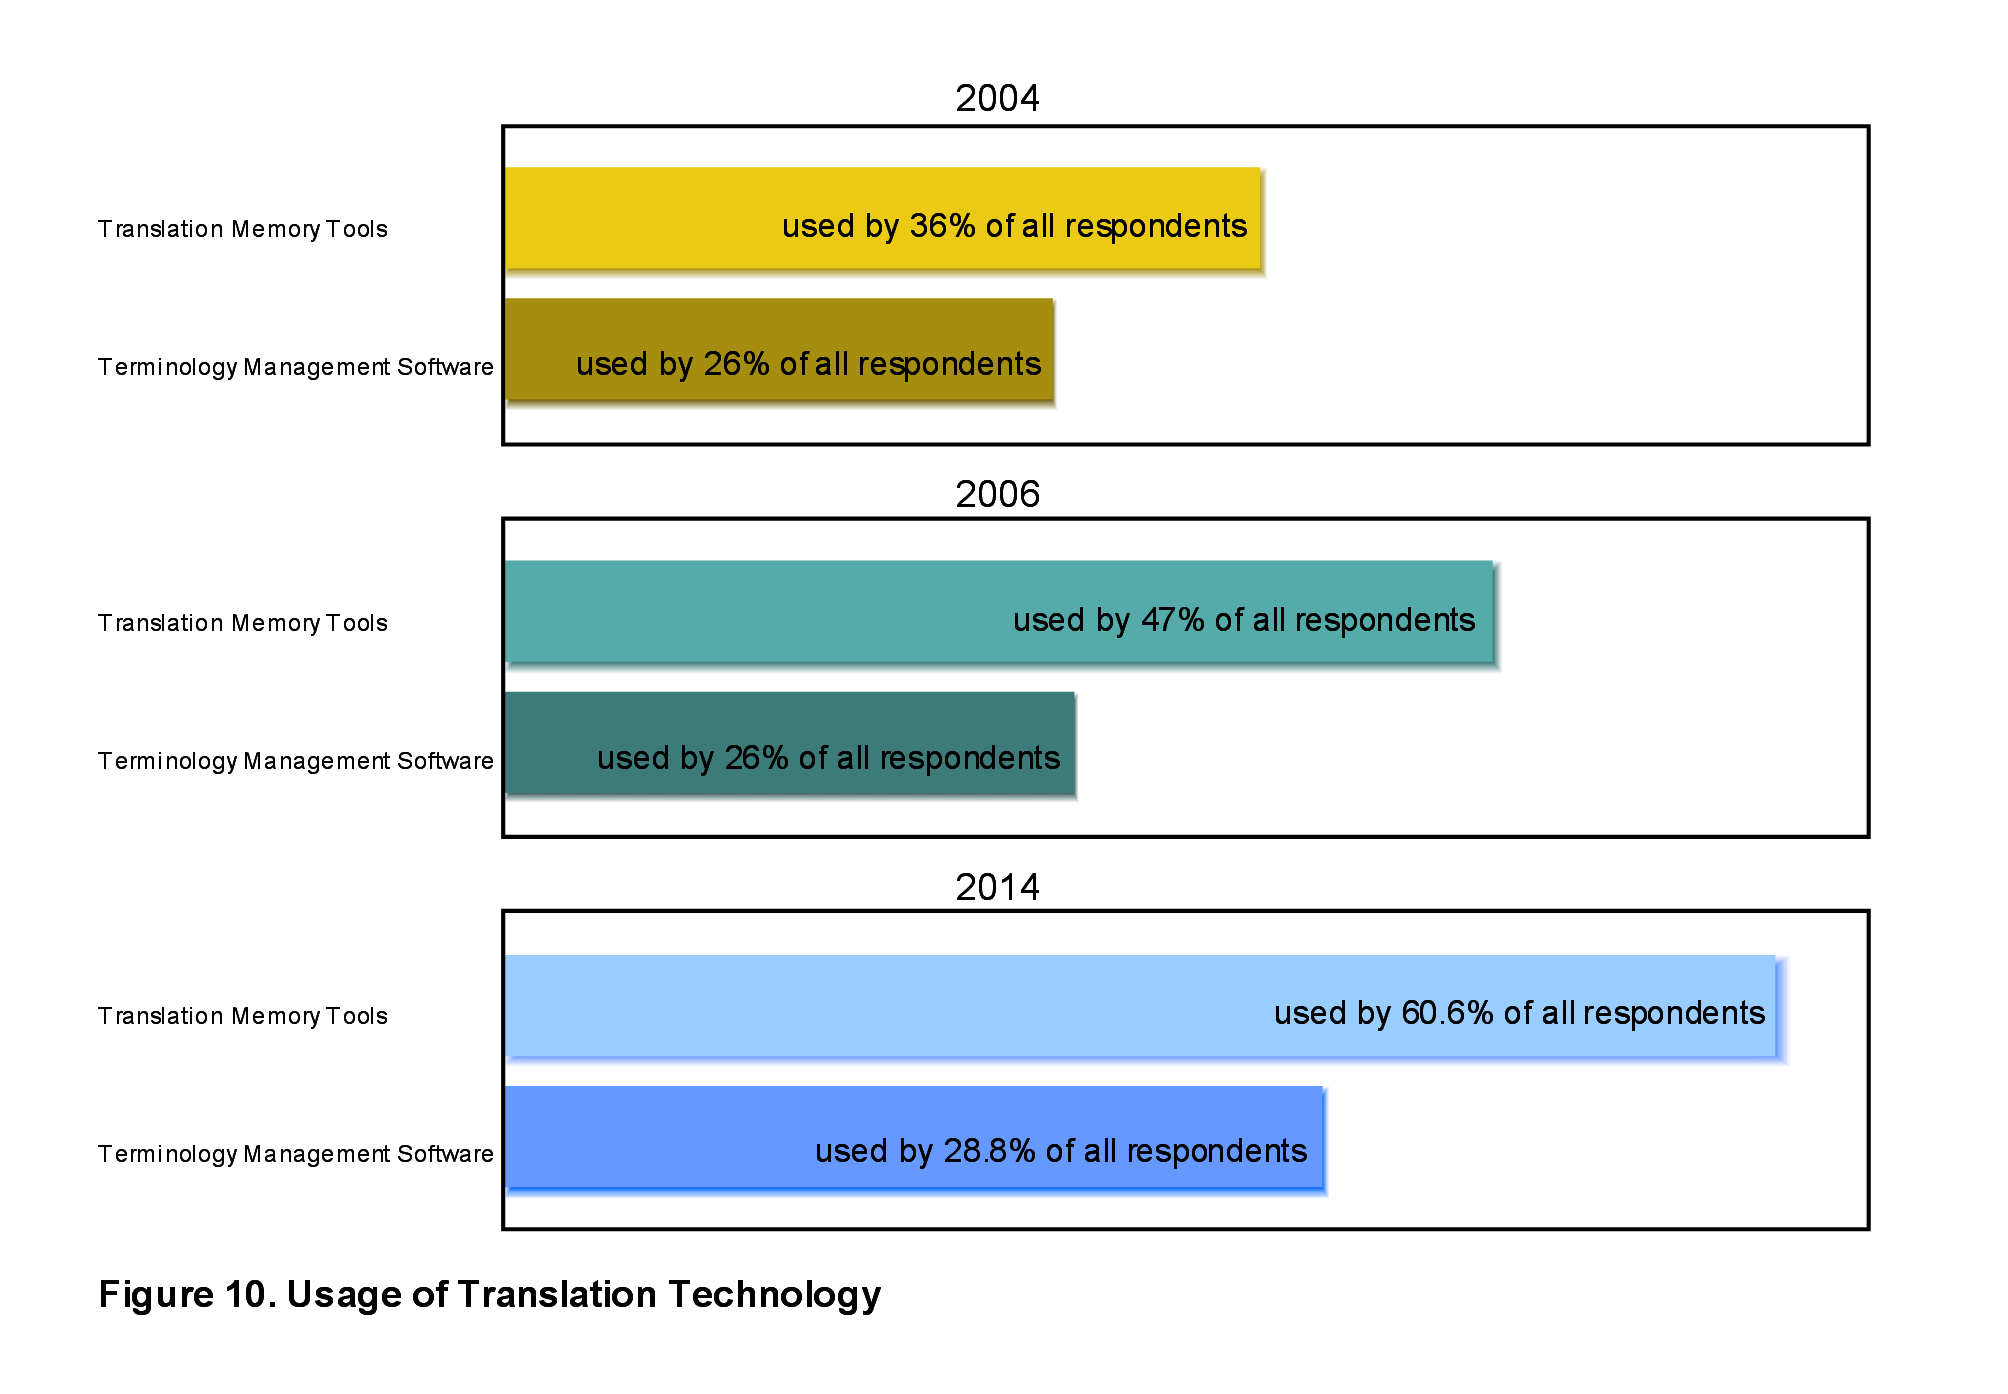
This information could be relevant when analyzing usage of language technology. For example, it would be interesting to know what impact the evolution of translation tools has had on users’ speed of translation, in relationship to the frequent claims of the developers of such tools. Some of the surveys tell us the percentage of respondents that used certain translation aids, but we cannot make any correlation between these percentages and speed of translation.
In 2004, translation memory tools were used by 36% and terminology management software by 26% of all respondents; in 2006, the percentages were 47% and 27%, respectively. In 2014, the usage of translation memory tools increased dramatically, being adopted by 60.6% of all respondents, while terminology management software was used by 28.8% of them (see Fig. 10).
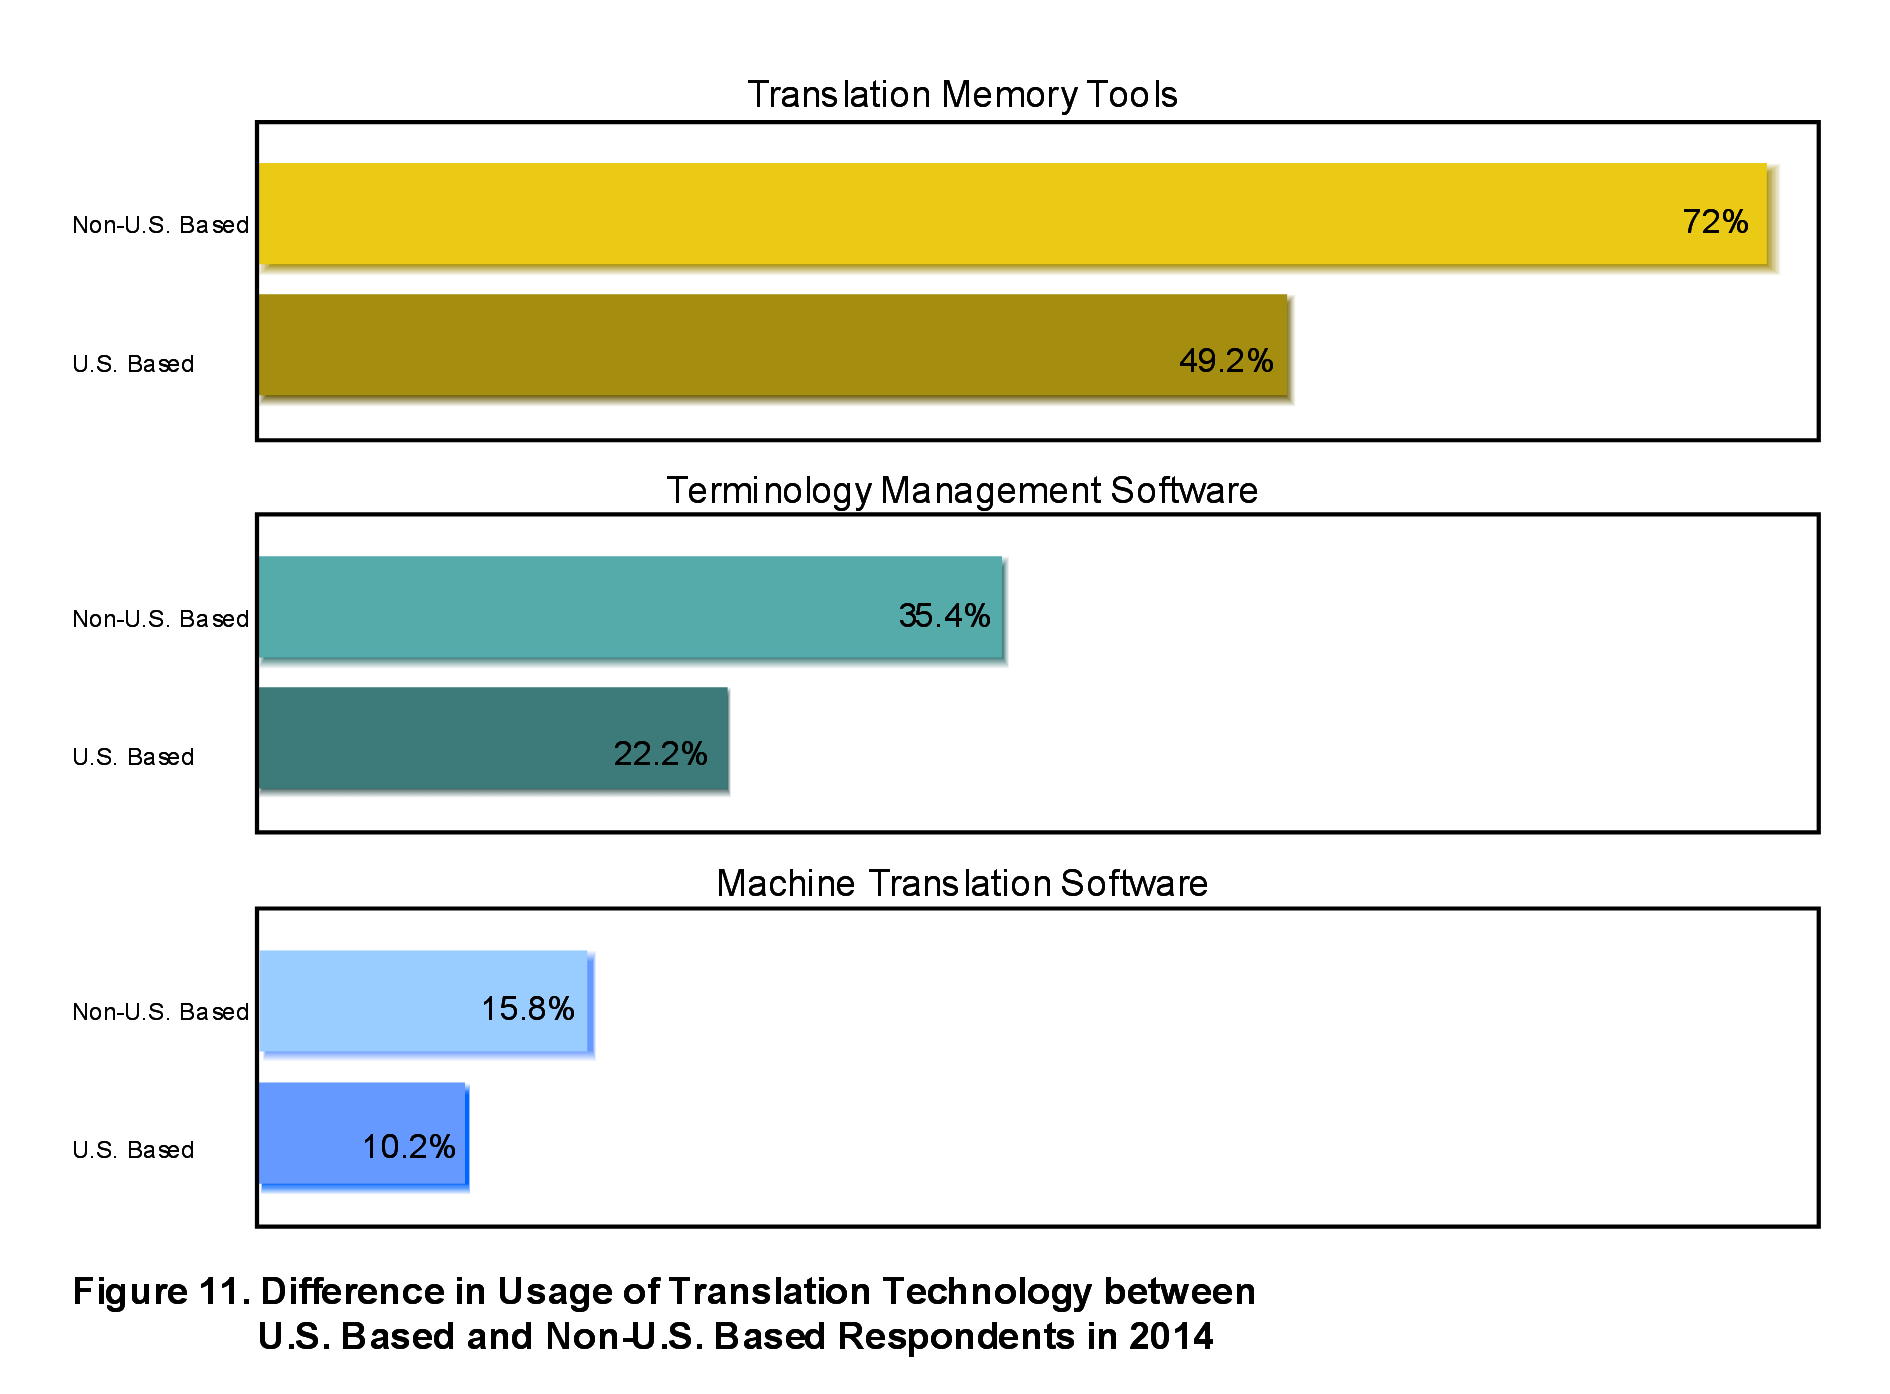
The 5th edition of the survey also shows the difference in usage of translation technology in the U.S. compared to the rest of the world in 2014. We also see that machine translation software made its appearance among the tools adopted by professionals in this industry (see Fig. 11).
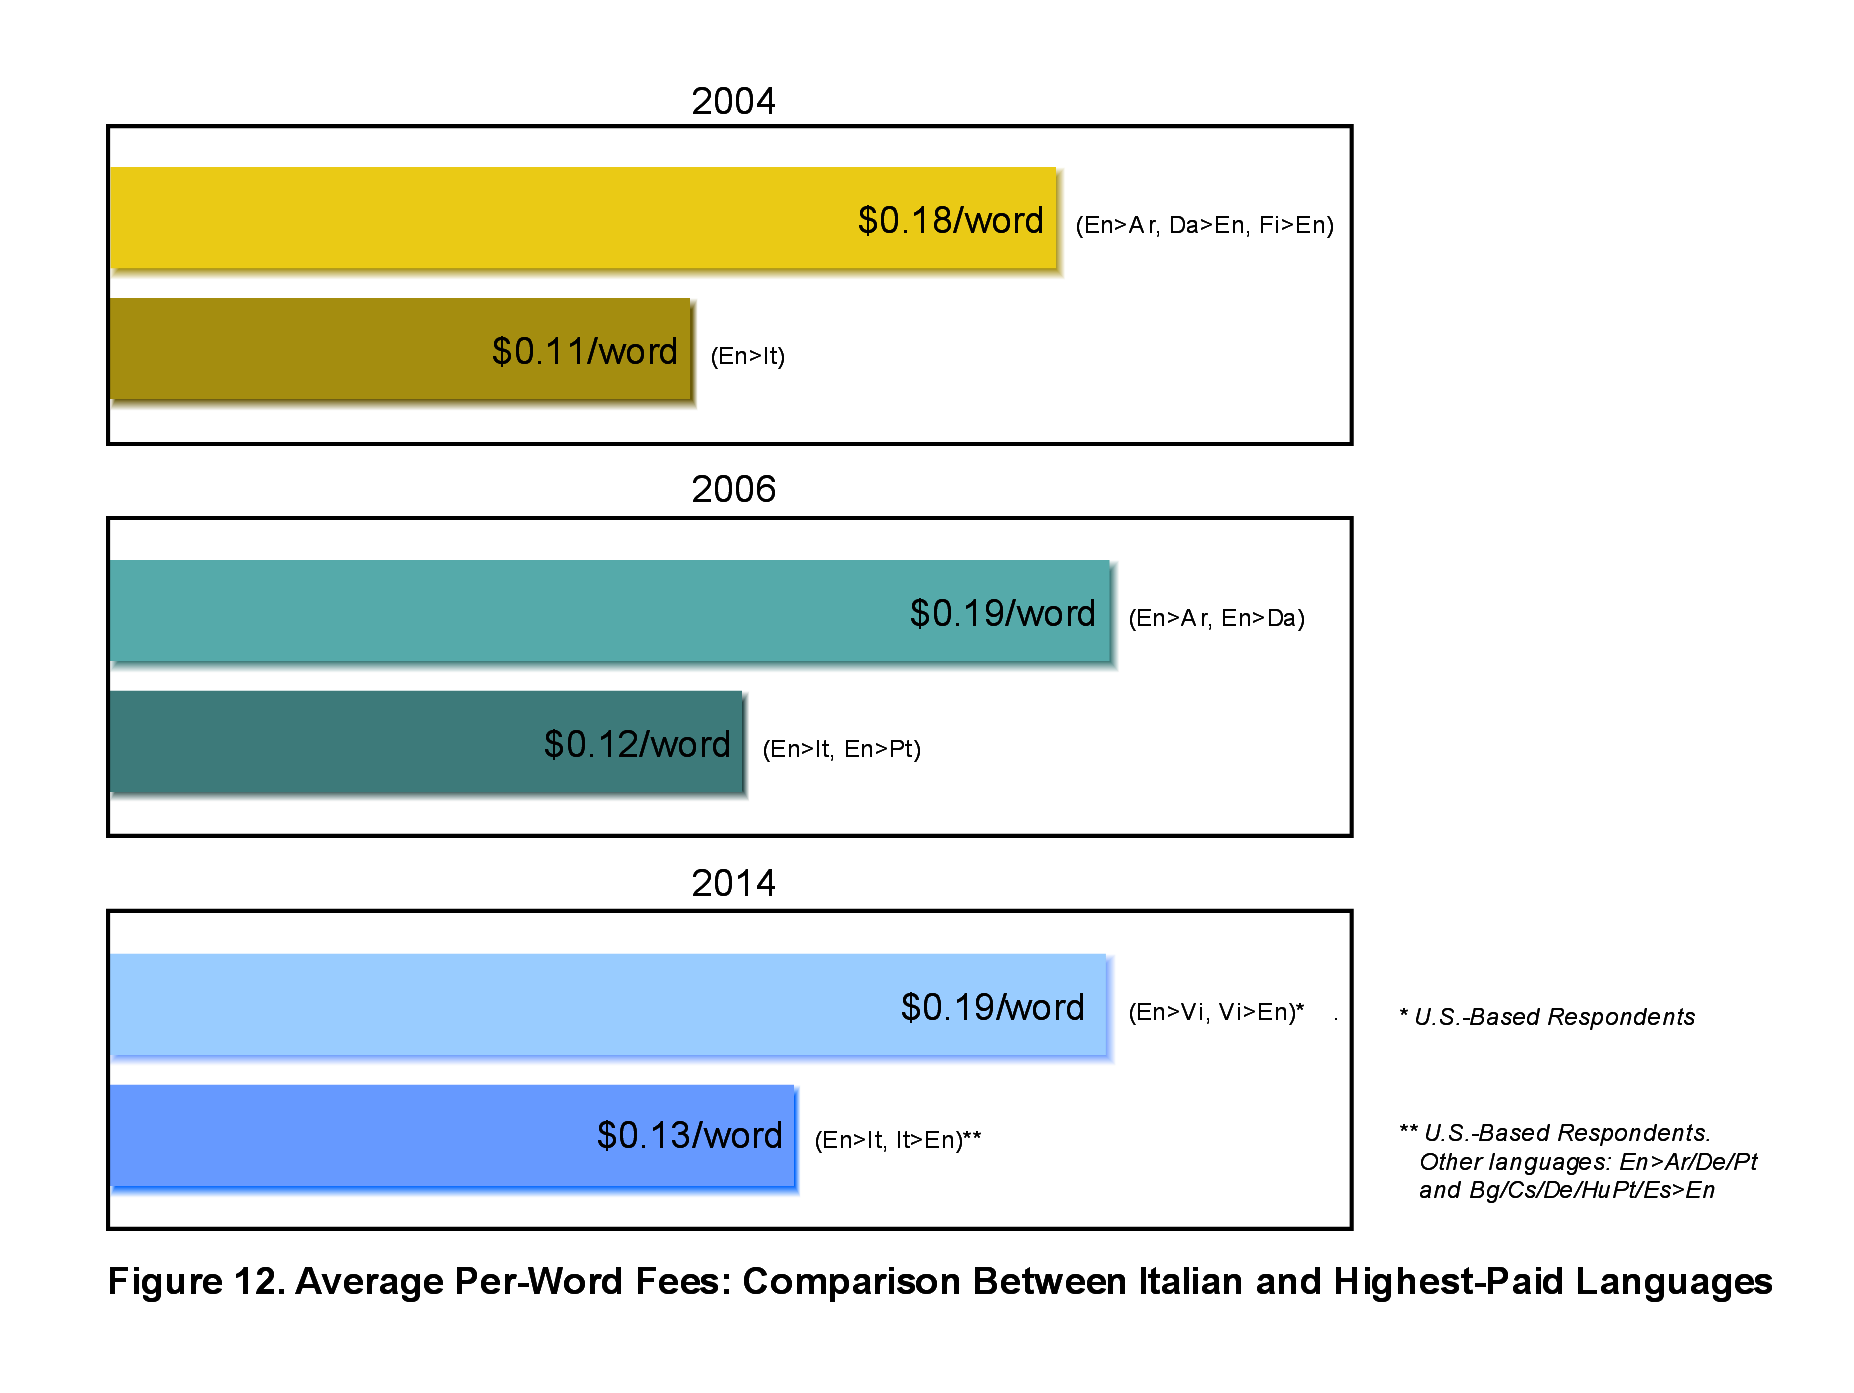
Finally, the average per-word rate for translation. Italian seems to be always at the bottom of the ranking. In 2004, the En>It combination was paid the least, $0.11/word; in 2006, it was again the lowest paid together with Portuguese at $0.12/word; in 2014 it was the second lowest with $0.13/word from and into English (see Fig. 12) with Bulgarian, Czech, German, Hungarian, Portuguese, and Spanish into English, as well as Arabic, German, and Portuguese from English. Polish from and into English was the least paid at $0.12/word. Where sufficient data allowed it, the last edition of the survey showed the difference between U.S. and non-U.S. fees. For Italian, this was $0.10/word from and into English.
These five surveys are snapshots that illustrate the situation in the past 20 years. The coronavirus pandemic is greatly affecting all industries and speeding up changes that were already underway. With new technologies, translators in the future may be compensated based on different criteria. Other parameters may come into play, and translators will probably be simply machine-translation post-editors. It is unlikely that we will still be paid by the word. Maybe we will be paid by the hour, or maybe other units of measure will be more appropriate. Either way, we hope that the next editions of the ATA’s Translator and Interpreter Compensation Survey will continue to help us shed light on our industry and our profession.
Chiara Giusti Castillo CT, was born and raised in Italy and resided in the U.S. for 17 years, where she earned a B.S. in Computer Science at Northeastern Illinois University in Chicago. She has worked in the translation business for nearly 30 years, both in Italy and in the U.S., specializing in medical translation, software localization and related marketing texts. She is a long-standing member of the American Translators Association and is certified in EN>IT.